In today's analysis, we will look at the recent price action of Litecoin (LTC) and its on-chain activity to understand fundamental trends and movements future potential Medium term.
Bitcoin's struggle to breach the $61,000 price level has put pressure on LTC. Which caused it to trade below the critical support level of $80. What motivates this behavior? Let's look at the details.
Litecoin (LTC) is trading just above a critical support level
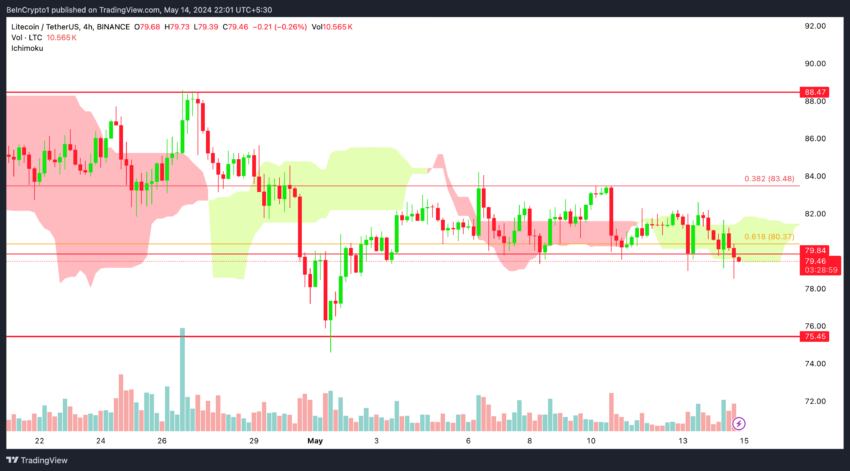
In the chart below, we observe the price action of Litecoin over a 4-hour period. The red lines highlight key support and resistance levels. Currently the price is around $79. A drop below the $75 range could trigger a series of selloffs. Which leads to even lower prices.

The $80.37 level, close to the $80 level, corresponds to the 0.618 Fibonacci retracement level which serves as crucial medium-term support.
Litecoin price recently attempted to break below the 4-hour Ichimoku cloud. If the price closes below the cloud. This could increase volatility and lead to a continued medium-term price correction to $75.
Read more: Litecoin (LTC) Price Forecast for 2024, 2025, 2026, 2027
If the price refuses to rise above the cloud, this may indicate a possible trend reversal.
Spending volume by age group reveals key market trends
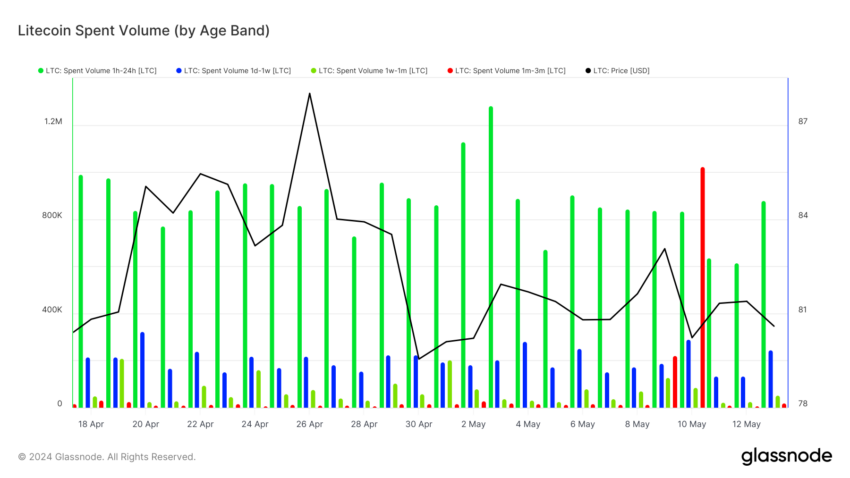
The charts shown display spending divided by age groups. Green bars represent LTC held for 1 hour to 24 hours before spending, blue bars show LTC held for 1 day to 1 week before spending, light green bars show LTC held for 1 week to 1 month before spending, red bars represent LTC Held 1 to 3 months before spending. The black line represents the LTC price in USD.

The largest volume is spent between 1 hour and 24 hours (on average, 800,000 LTC is spent per day). Which indicates a lot of trading activity in the short term. This rapid trading activity can make the price more volatile.
Learn more: How to buy Litecoin LTC in 4 steps?
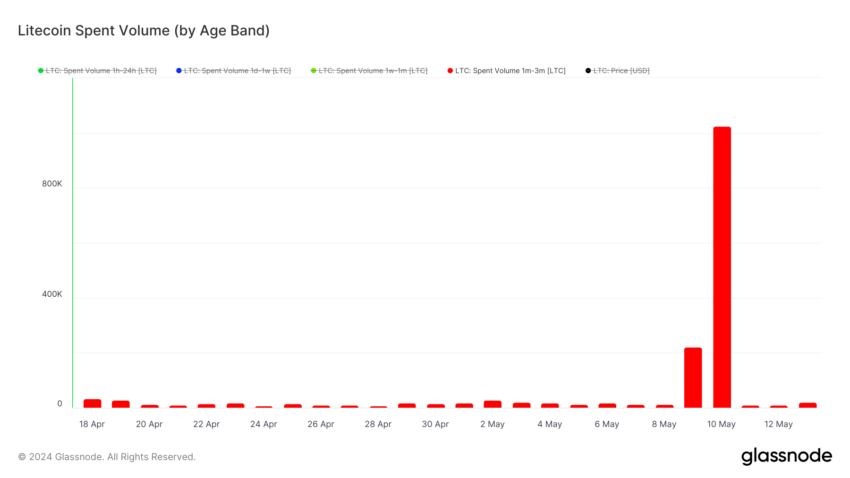
On May 10, significant selling was experienced by medium-term holders, those who hold LTC for 1-3 months. This may indicate a change in sentiment or profit-taking behavior. These increases could lead to a fall in prices in the medium term.

Strategic Decision Making and Forecasting for Litecoin
- Outlook: Bearish to Neutral: LTC price is struggling below the $80 support level, showing weakness after Bitcoin challenges at $61,000. This sparked fear among shareholders, with short-term investors exiting to cut their losses.
- Conditional support: If Bitcoin price falls below 61,000, LTC could face a notable price decline in the medium term to $75.
- Price forecasts and recommendations: In a bearish scenario, LTC could fall to $70 if the Bitcoin price falls to 59,000. To reduce risk exposure, traders should wait for the price to drop below $75 before buying. The ideal buying range would be between $70 and $72 for an optimal entry position. It is recommended to set a stop loss at $68 to manage potential downside risks and to target a sale price between $85 and $90 to benefit from the next bullish wave.
Best Cryptocurrency Trading Platforms
Of confidence
Disclaimer
All information published on our website is offered in good faith and for general information purposes only. Therefore, any action, behavior or decision taken by the reader in accordance with this information is solely the responsibility of itself and its affiliates individually, and the site assumes no legal responsibility for such decisions.
الأسواق,تحليل لايتكوين (LTC)

Comments
Post a Comment