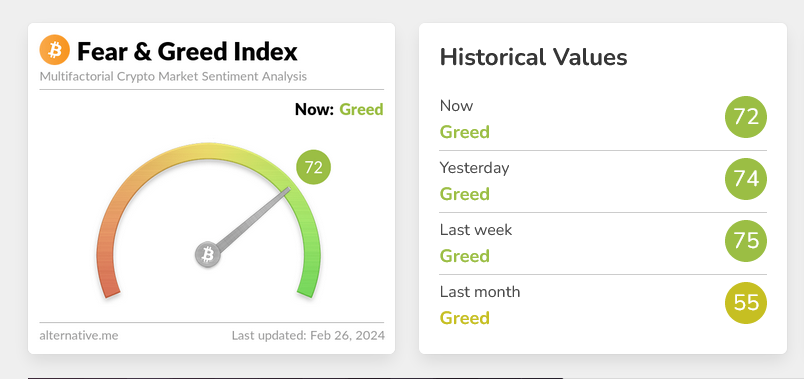
Today, the popular Fear and Greed Index returned to extreme greed territory, with a reading exceeding 75 points. Although this situation may persist for weeks or even months in the cryptocurrency market, the strong similarity between the current movements of the index and those occurring during the 2019-2020 period indicates the possibility of a deeper correction .
If it decreases Bitcoin BTC Value Well before the halving (reduction in the number of new Bitcoins mined), it could retest the $20,000 zone. This matches the price movements and events leading up to the previous halving. There is also the possibility of a moderate correction (around 21%) after the halving, which proved to be an ideal buying opportunity last time.

Appear Today, the Fear and Greed Index shows 76 points, which is in the dark green range that indicates extreme greed. These sentiments usually indicate an impending correction, but they may persist for a relatively longer period of time in the cryptocurrency market.
Interestingly, the average Fear and Greed Index reading over the past month was 48 points. This reflects a state of relative neutrality among market participants, which typically accompanies periods of consolidation and sideways trends.
Similarity to Fear and Greed Index movements before previous halving
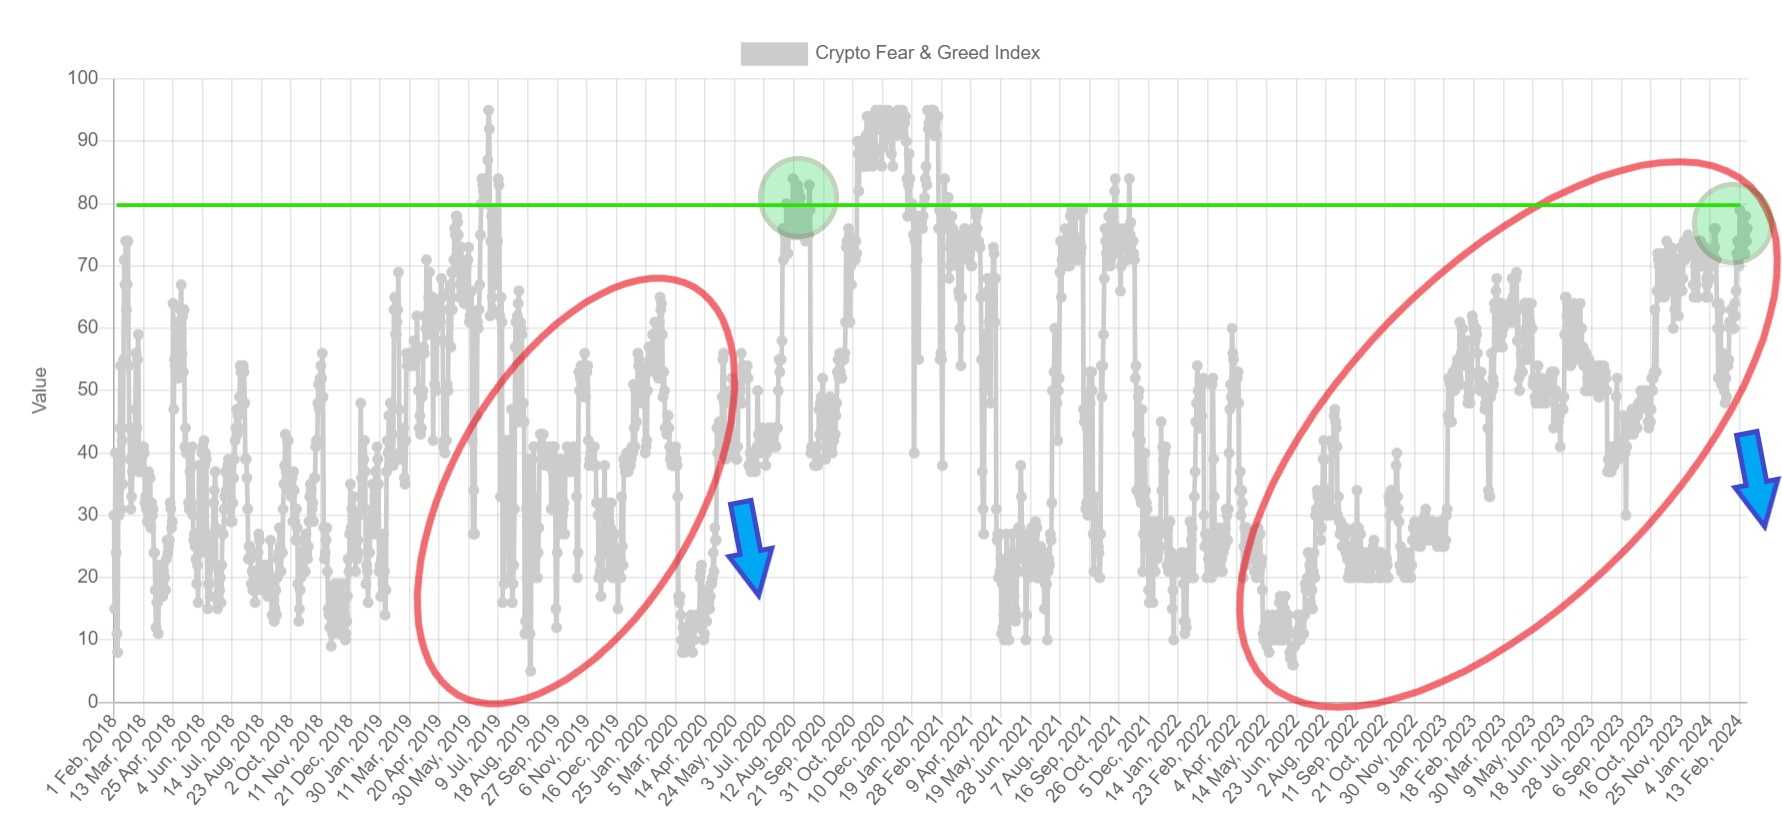
The movements of the Fear and Greed Index on the chart over the past 12 months should then be compared to the movements that occurred during the corresponding period leading up to the previous halving. Which happened in May 2020 and was preceded by strong fluctuations in the price of Bitcoin.
Also read: Will the price of Bitcoin (BTC) increase before the next halving?
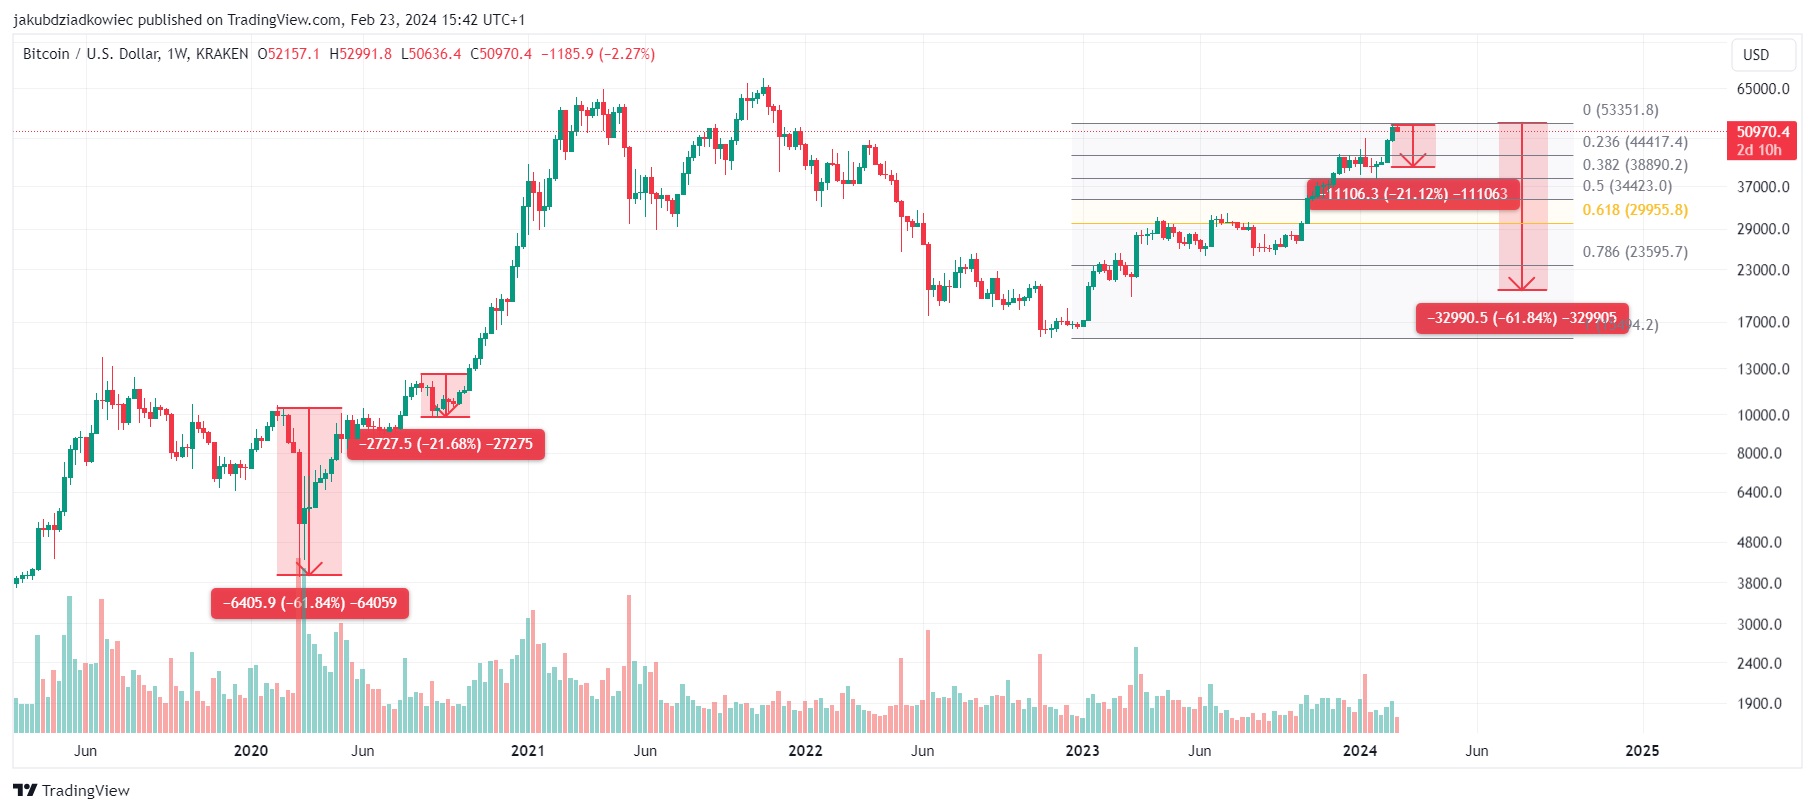
The peak of this volatility was a 62% drop in the price of Bitcoin in March 2020. This was of course due to the collapse that hit global financial markets due to the Covid-19 pandemic.
Despite this exceptional event (black swan), we see similarities between the two occurrences (areas highlighted in red). First, the rise in Fear and Greed Index values was associated with a gradual rise in the price of Bitcoin, from significant declines. In 2020, this rise led the index to enter the greed zone (above 55 points).
On the other hand, we have slightly exceeded this point today, with values above 75 points recorded for several days in 2024.

The 2020 crash ended with the Fear and Greed Index returning to extreme fear territory, reaching around 10 points. This happened 3 months before the previous Bitcoin halving. Under current circumstances, two months before the halving process and with the market temperature rising. The probability of a deeper correction (blue arrow) remains high.
Extreme Greed and the Price of Bitcoin
Additionally, it is worth noting that the Fear and Greed Index did not reach the extreme greed zone until the previous cycle halving. Unlike the current situation, the index only exceeded 75 points after the halving process, when the price of Bitcoin reached the $12,000 zone (green zone).
It turns out that the first test of this defensive level (green line) resulted in a rejection. Bitcoin last briefly fell below $10,000 in September 2020.
If such a situation also occurs today, a correction of around 21% in the Bitcoin price is still possible.
At this point, Bitcoin price will test the $41,000 zone. It is slightly above the 38.2% Fibonacci retracement level for all upward moves within a year.
On the other hand, if a stock market crash similar to the COVID-19 events occurred before the halving, the price of Bitcoin could fall by around 62%. Bitcoin will then reach $20,000 again, which seems very unlikely under current market conditions.

But despite these similarities in frequency, each Bitcoin cycle plays out a little differently. The extreme readings of the Fear and Greed Index are unlikely to lead to a deep correction this time around.
With the Securities and Exchange Commission (SEC) approving Bitcoin ETFs. The oldest cryptocurrency is becoming an increasingly recognized and trusted global asset. This, in turn, dampens the volatility of the overall cryptocurrency market. Which makes deep corrections and unreasonably high breakouts less common.


Comments
Post a Comment